Waste Series Article 3
 The rapidly increasing production of single-use plastics is overwhelming the world’s ability to dispose of them correctly, hence why plastic pollution is one of the greatest environmental issues. The developing nations of Africa and Asia are responsible for a large portion of the plastic pollution thanks to ineffective or non-existent rubbish collection and disposal schemes. The developed world also has problems disposing of plastics correctly, particularly in areas with low recycling rates.
Plastics made from fossil fuels began to be produced just over 100 years ago, and production accelerated massively after World War II. Plastic has been an extremely useful invention – medical devices were revolutionised by plastic;  plastic made space travel possible; cars and aeroplanes would still be extremely heavy and producing vast quantities of pollution if it wasn’t for plastics; the collection and distribution of clean drinking water worldwide is thanks to plastic. The ease and convenience of plastic has led to a throw away culture, however. Products like food wrappers and plastic bags can have lifespans as short as a few minutes, but they will likely stay in the environment for hundreds of years.
Here I’m going to give you some of the plastic facts and stats, talk to you about plastic and our oceans and the affect plastic is having on wildlife. If you want to learn about some ways on how you can minimise your part in the plastic problem check out Article 4: The Plastic Problem – What You Can Do, and Article 6: Relearning How To Recycle – Tips And Tricks.
The Facts and Stats
Plastic production has increased exponentially from 1950 with 2.3 million tons produced in a year, to 2019 with 460 million tons. This is expected to double by 2050. This means that half of all the plastic ever made has been manufactured in the last 15 years, which is crazy considering its been around for a 100 years.
Plastic often contains additives to increase its durability, strength and/or flexibility which then increases the life of those products too, with some plastic items now estimated to take 400 years to breakdown. Yet, 40% of all plastic produced each year is single-use, meaning this plastic’s “useful” life (which can be as short as a few seconds) is less than the blink of an eye in the course of its whole life.
Before 1980, 100% of plastic was simply discarded; plastic which was incineration and/or recycling was negligible. By 2015, 25% was incinerated and 20% was recycled, but that still left 55% being discarded and improperly dealt with. High-income countries are responsible for more plastic waste per person; however, low-income countries are responsible for the majority of mismanaged 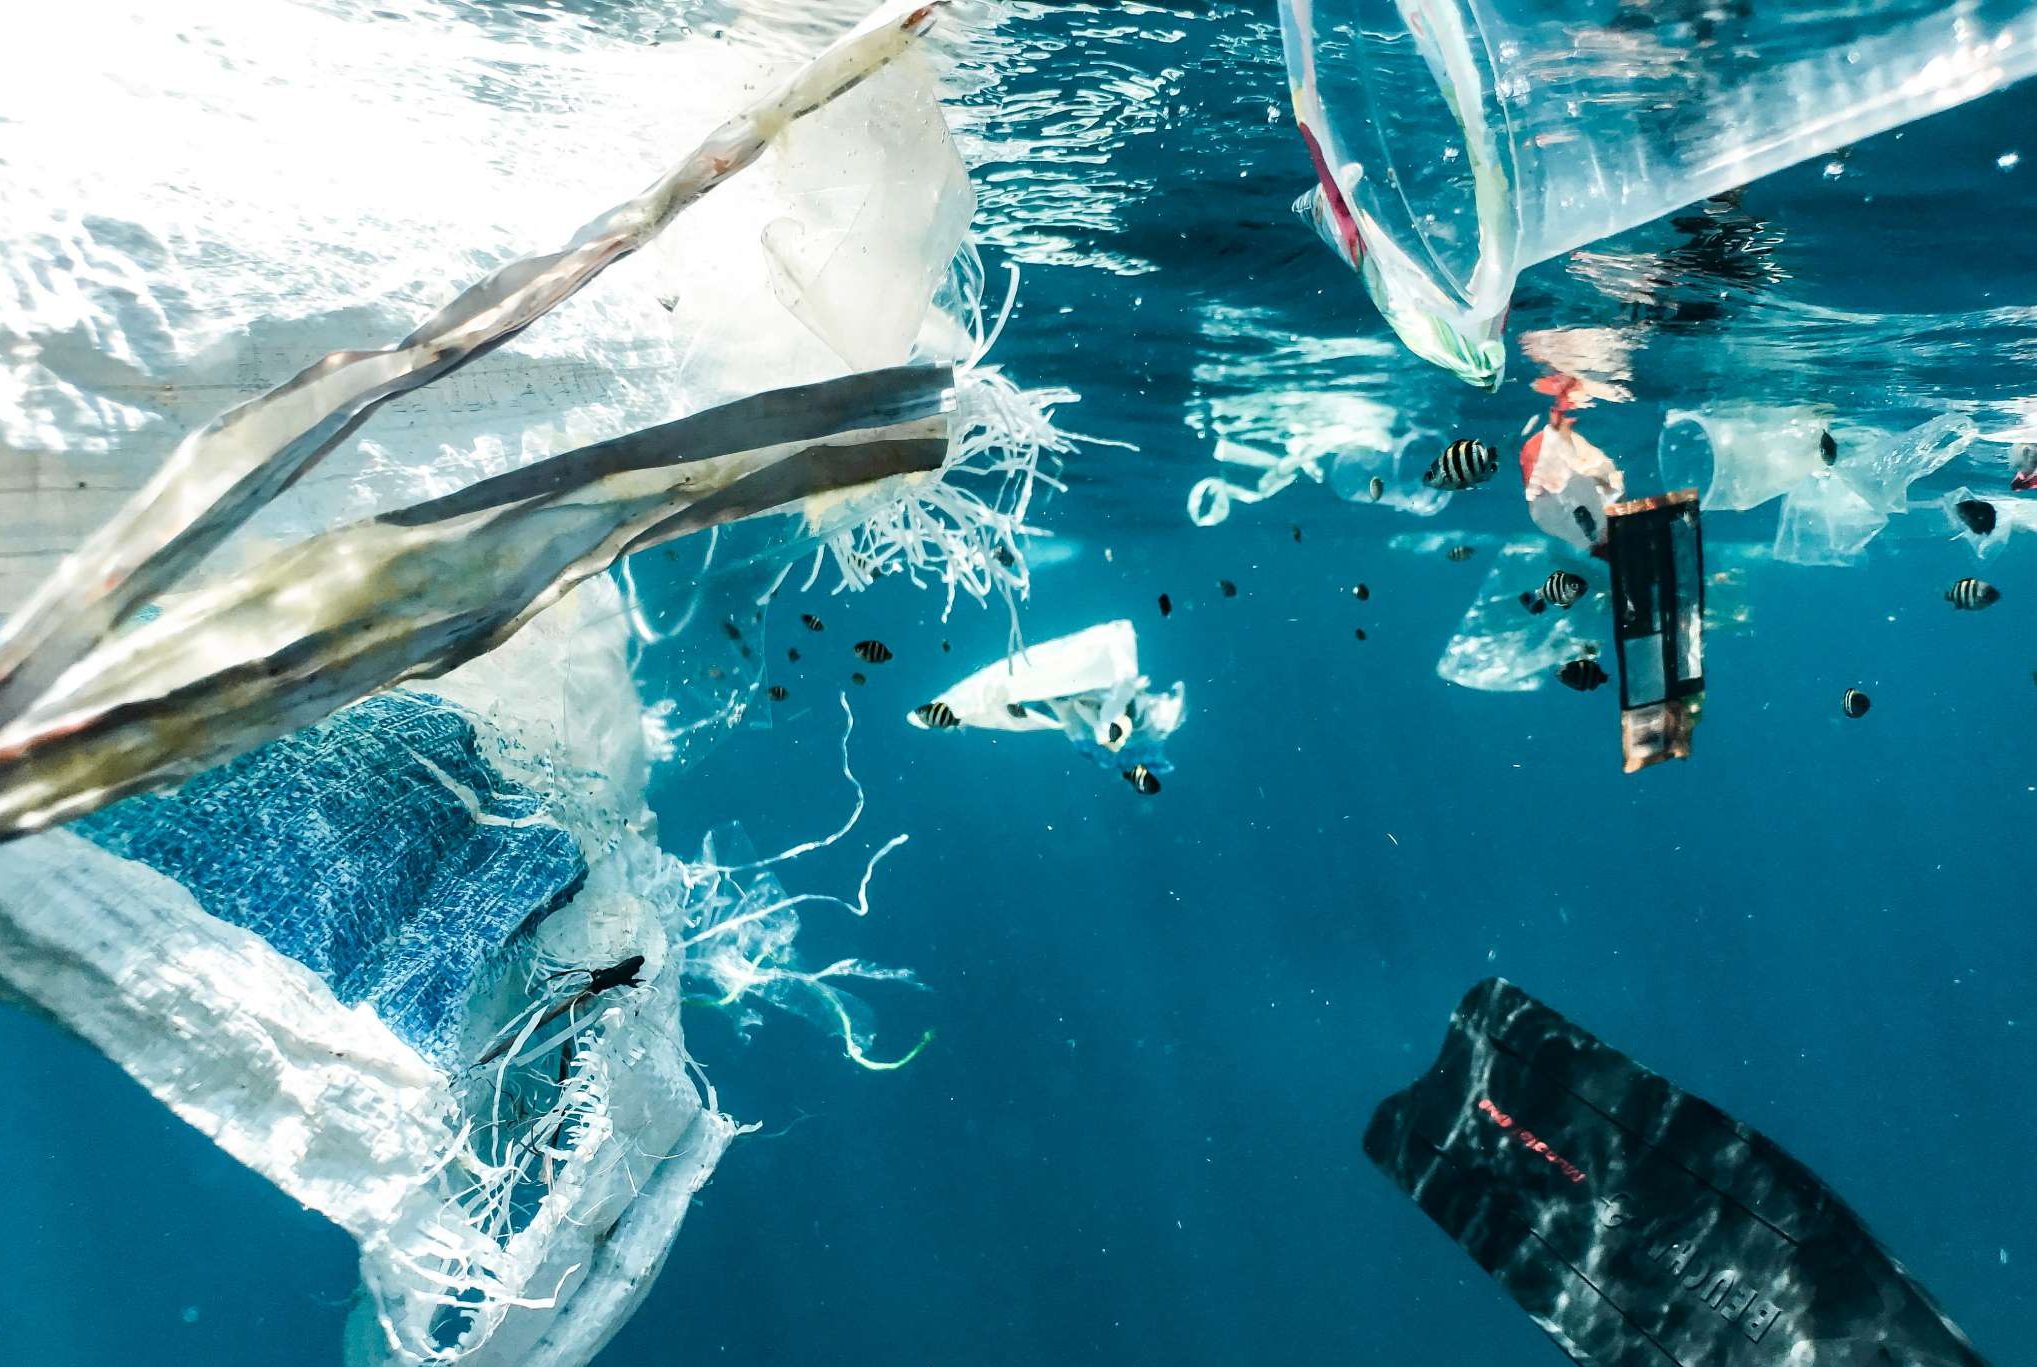 plastic which subsequently ends up in our waterways.
70% to 80% of the plastic in oceans has been transported into the seas from our rivers and coastlines. It is approximated that eight million tons of plastic enter the oceans from coastal nations each year. The remaining 20%-30% of plastic in the ocean comes from marine sources e.g., fishing nets, ropes, lines, abandoned vessels, etc. These marine plastics are thought to make up more than 80% of the Great Pacific Garbage Patch (more on this later).
Our Oceans
As we’ve discussed, it is estimated that about eight million tonnes of plastic enters the oceans from coastal nations each year. But  how much plastic is there in there already? And where is it all?
Well, in 2013 the surface plastic in all the oceans was estimated at 268,950 tonnes. Most of that tonnage was thought to be made up of macroplastics (pieces of plastic larger than 20cm across), while the majority of the pieces of plastic (which were estimated to total five trillion) were thought to be microplastics.
Most of this surface plastic was found in the Northern Hemisphere which makes sense as the majority of the world’s population (and coastal populations) are in the Northern Hemisphere. Yet, a large quantity of surface  plastic was still found in the Southern Hemisphere because of the movement of current, winds and gyres. This movement in the oceans is how we have ended up with large aggregations of plastic known as oceanic “garbage patches”. The most famous is the Great Pacific Garbage Patch (GPGP) which is estimated to be 1.6km2 – larger than Alaska (the biggest state in the US) or three times the size of Spain. 99.9% of the GPGP is plastic, 75% of which is thought to be discarded, lost or abandoned fishing gear. There are 1.8 trillion pieces of plastic in the GPGP, amassing 79,000 tonnes which is about 30% of the surface plastic in our oceans. There is thought to be an exponential increase in the concentration of surface plastics in the GPGP.
Each year we release millions of tonnes of plastic into the oceans, and in previous decades we’ve released tens of millions of tonnes. Yet, that doesn’t match what we can find. We should be seeing much more plastic which leads us to wonder where all the other plastic is. Some people suggest that we might have just grossly overestimated the amount of plastic we have produced, which would be really lovely if it’s true. It’s also possible we’ve underestimated the amount floating at the surface. Another popular explanation is that UV light and wave action breaks plastic down into smaller fragments which more easily become part of the sediment and/or are ingested. Or, the plastic might not be broken down as fast as we think, instead it has sunk into our extremely vast and deep oceans, become covered by sediment, and lost into the abyss where it will remain for decades.
The Wildlife
What does all this plastic in our oceans mean for the organisms living in it? Since the 1980s there have been peer reviewed articles published on the impacts of plastic, yet it is widely acknowledged that we still do not know the full extent of the impact plastic has on ecosystems.
What we do know though, is that there are three main ways in which plastic affects wildlife:
 Interaction.
This includes collisions, abrasions, obstructions and use as substrate. For example, plastic can interfere with substrate by blocking light, oxygen, organic matter etc. And plastic, such as fishing gear, colliding with coral reefs and sensitive structures can cause serious damage and abrasions.
You have probably already seen the horrible pictures of marine animals caught up in plastic debris (most commonly plastic ropes and nets, but also bags and packaging). So far entanglement has been reported in almost 350 species. This includes all marine turtle species, almost 70% of seal species, over 30% of whale species, 25% of seabird species, 89 fish species and 92 invertebrate species as well.
 This can occur directly (both intentionally and accidentally) and indirectly (by eating prey containing plastic). In 2015, 233 species had been documented ingesting plastic – all marine turtle species, a third of seal species, approximately 60% of whale and seabird species, 92 fish species and 6 invertebrates – but these numbers are going up all the time. The size, type and amount of plastic ingested by an organism depends on its size. Small filter feeders and detritivores like mussels and some crabs take in plastic fibres. Food packaging and plastic films are found in larger organisms such as large fish species. And then there are the massive animals, like sperm whales, who have had nine metres of rope, four and a half metres of hose, flowerpots and plastic sheeting found inside them. Once ingested, plastic limits the appetite and amount of food the organism can consume, seriously impacting its health and ability to survive. The plastic can also cause ulcers and create holes in the digestive system, resulting in death. Furthermore, the chemicals and toxins in plastics have been shown to reduce metabolism, reproductive ability and enzyme activity, and cause cell death after ingestion.
To learn about what you can do to reduce the problem, check out Article 4: The Plastic Problem – What You Can Do.
Statistics sourced from the National Geographic Society and Our World in Data.


© 2026 Operation Wallacea Ltd. Website by Yello Media.
Social Media Links